
In contrast to the Cholesterol Treatment Trialists (CTT) individual patient data meta-analyses (IPDMAs), the USPSTF systematic review and meta-analysis (SRMA) uses aggregate data meta-analysis (ADMA). ADMA is more common, in part because of the extensive work required to do IPDMA. In fact, most – if not the vast majority of – meta-analyses are likely to be ADMAs, not IPDMAs. Although more common, ADMAs have a certain loss of granularity in data given they use study-level (rather than individual patient-level) data. Nevertheless, what did the USPSTF SRMA find about statins for primary prevention of cardiovascular disease (CVD), especially in terms of a dose-response effect?
In the USPSTF SRMA, inferences are relatively limited for some outcomes compared with others. For example, although fatal stroke has data totaling 115 events across 29,520 people, these come from two moderate-intensity statin trials (RR under a random-effects model using restricted maximum likelihood [REML] estimator for 𝜏2 : 0.63, 95% CI 0.15 to 2.58) and one high-intensity statin trial (RR 0.5, 95% CI 0.13 to 2.00), with the majority of events (100 of 115) coming from one moderate-intensity statin trial. Even though there’s nothing to suggest a dose-response effect, these data are too limited to offer robust insight. Indeed, the USPSTF authors make a similar comment regarding a dose-response effect. However, this limitation is not universal across all the outcomes in consideration.
Consider the cardiovascular (CV) composite outcome. Composite outcomes come with potential problems. An often-debated outcome in CV composites is revascularization: It’s prone to subjectivity and is generally less important to people than something like a heart attack or stroke. For the present discussion, this is not overly concerning. Although both the USPSTF and CTT include revascularization in their composites, a review of corresponding data for the individual outcomes contributing to the composites offers reassurance that revascularization does not have undue influence. That said, even composites solely comprised of so-called “hard” outcomes may have components with different relative importance, such as someone fearing a stroke more than a heart attack or vice versa. Despite any misgivings one might have with composites, the clinical reality is primary prevention focuses on the 10-year risk of a CV event (by definition, a composite outcome), as reflected by the major guidelines and predictive models used in this area, such as the Pooled Cohort Equations or the recently published PREVENT equations (see related app), though the PREVENT equations also predict the risk of the components of the composite outcomes.
So, then, what of the CV composite in the USPSTF SRMA?
Below is a forest plot of the trials contributing to the CV composite outcome, grouped by the statin intensity level used in the trial (all analyses that follow were conducted using meta [6.2-1] in R [4.3.0]). Spoiler alert: The data do not support a dose-response effect based on statin intensity.
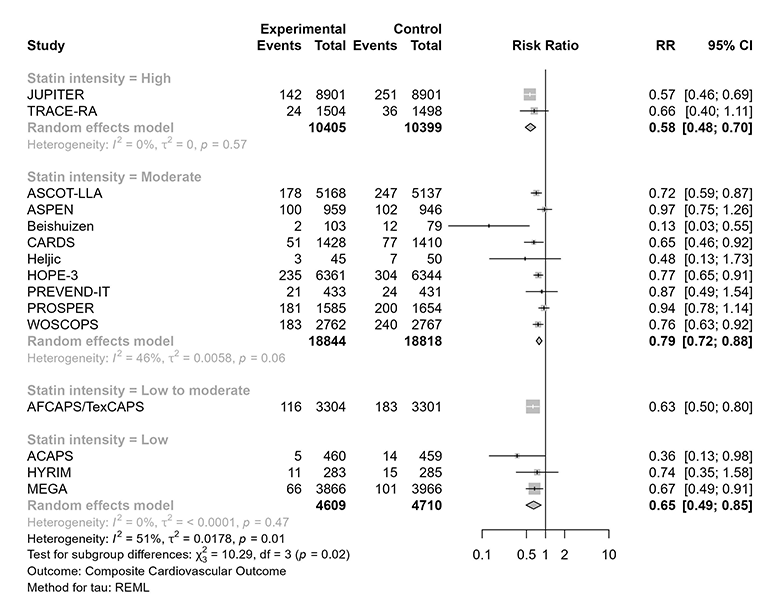
Visual inspection “tells a tale”: Low- and low-to-moderate-intensity statin therapy have consistent effects, and both are essentially consistent with high-intensity statin therapy. If anything, one might notice the general direction of effect estimate variation would suggest any of these approaches might be “better” than moderate-intensity statin therapy (but one should not read too much into this). In any case, the pattern does not support a dose-response effect for statins in primary prevention.
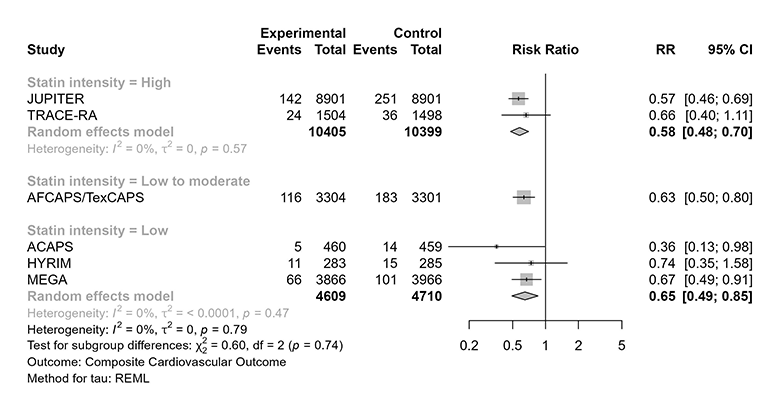
It is perhaps worth noting that a formal test for subgroup effects among the low-, low-to-moderate-, and high-intensity trials would not reach conventional thresholds for statistical significance (far from it). This can be appreciated visually in the figure below, but formal testing yields p = 0.74.
But does any of this conclusively demonstrate there is no dose-response effect for statins in primary prevention? Well – you guessed it – it’s complicated.
The above is a comparison between studies. When attempting to examine subgroup effects in meta-analyses, relying solely on comparisons between studies can be problematic and lead to mistaken inferences; all else equal, subgroup analysis based on comparisons within studies would be more convincing. And of course, all the other considerations for subgroup analyses also apply here; this is just an important additional consideration for subgroup analyses in meta-analyses.
Relatedly, there is trial evidence – albeit with potential indirectness given it comes exclusively from secondary prevention trials – that higher doses of statins might offer somewhat greater protection against CV events. Consider, for example, TNT (atorvastatin 80 mg vs. atorvastatin 10 mg), PROVE IT-TIMI 22 (atorvastatin 80 mg vs. pravastatin 40 mg), A to Z (simvastatin 40 mg increasing to simvastatin 80 mg vs. placebo increasing to simvastatin 20 mg), IDEAL (atorvastatin 40-80 mg vs. simvastatin 20-40 mg), and SEARCH (simvastatin 80 mg vs. 20 mg).
Although not all these trials gave a clear indication of benefit (e.g., SEARCH), others did (e.g., TNT, IDEAL). And these are not subgroup analyses. These trials randomized patients to higher vs. lower statin doses. When considering these trials together, the CTT group found – in an earlier analysis that was not dependent on the degree of LDL-C reduction – a rate ratio of 0.85 (95% CI 0.82 to 0.89), even though the absolute benefits were what many might consider to be modest (e.g., about a 2.2% absolute risk reduction [ARR] for the major CV event outcome over a median follow-up of 4.9 years for TNT and about a 1.7% ARR for the major CV event outcome over a median follow-up of 4.8 years for IDEAL).
So, where does that leave us? Sorry for a cliffhanger, but that’s the topic for next week!